


Cart abandonment gets most of the attention in e-commerce conversion work. Teams focus on product discovery and reducing checkout friction. But even when a shopper reaches the end of checkout, you still don’t have a conversion.
The concern is for good reason. The average online shopping cart abandonment rate sits at 70.22%, driving a lot of predictable conversion rate optimization (CRO) tips focused on streamlining checkout steps and improving product discovery.
For card-not-present merchants, the conversion moment is the issuer’s authorization decision and whether that approval becomes a paid, settled order. This is the reason why two teams can run the same CRO optimization tips and see different results, as we’ll explore in this blog.
What is conversion optimization in e-commerce?
Conversion rate optimization (CRO) involves increasing the percentage of site visitors who complete a desired action (usually a purchase) by identifying drop-offs and measuring what improves performance.
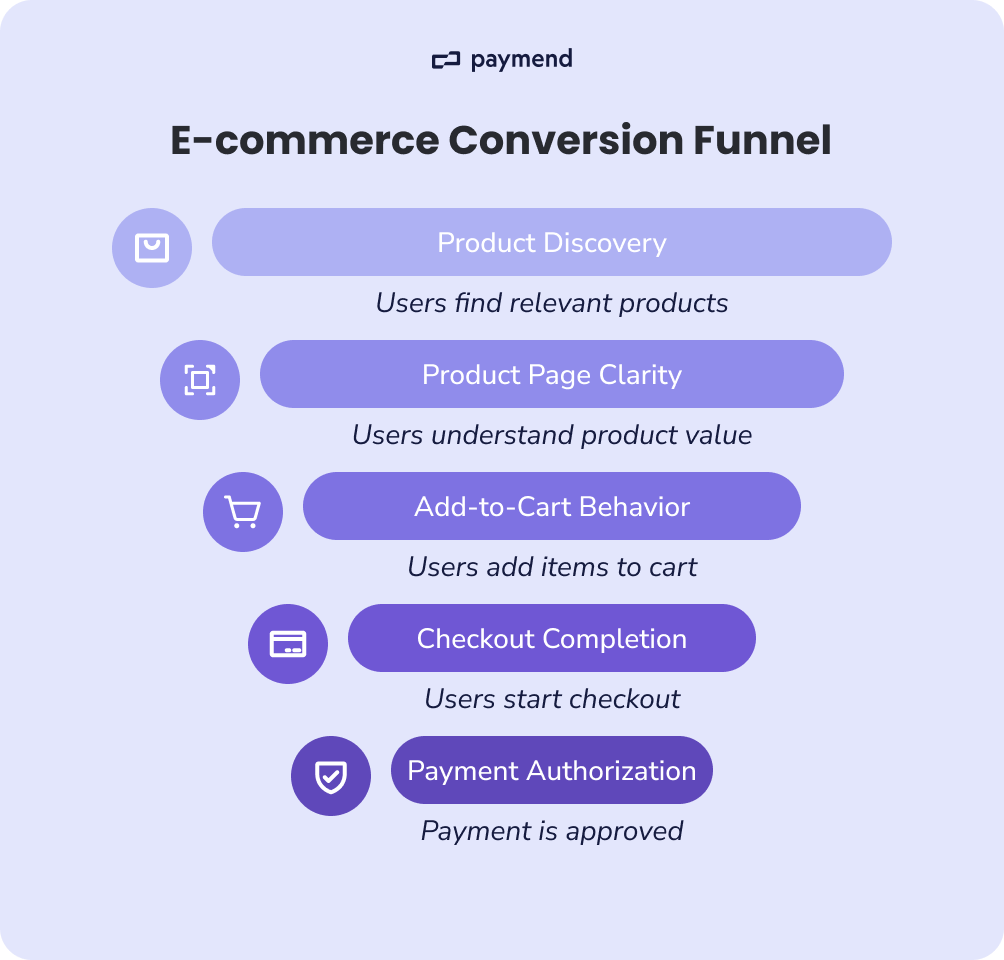
In e-commerce, CRO often focuses on best practices like product discovery, product page clarity, add-to-cart behavior, and checkout completion.
“Completed checkout” isn’t the same thing as a successful order. For card-not-present merchants, the conversion moment is the authorization decision. This factor is influenced by issuer risk controls, fraud systems, and processing conditions outside your storefront UX. A complete CRO definition needs to include the payment-success layer: how often legitimate customers attempt to pay and still get declined.
How to calculate e-commerce conversion rates
Start by getting specific about which “conversion” you mean. In e-commerce, there are multiple conversion rates, and they can tell very different stories.
1. The standard e-commerce conversion rate
This one is the headline metric most teams report.
e-commerce conversion rate = [Orders ÷ Sessions (or users)] × 100
Use sessions if you’re tracking funnel performance and marketing traffic quality, and use users if you want a cleaner view of unique visitor intent (with less repeat-session noise). Whatever you choose, stay consistent. Switching denominators mid-reporting makes trends meaningless.
2. Funnel conversion rates that explain where you’re losing revenue
Your headline conversion rate tells you what happened. Funnel conversion rates tell you where it happened. Instead of treating “conversion” as one number, funnel rates break the journey into stages, including browsing, intent, checkout, order, and payment.
By using the formulae below, you can see exactly which step is causing revenue loss and decide what to fix first. That’s also why teams use funnel rates for testing, as they are earlier signals than final orders.
Here are three core funnel rates most e-commerce teams track:
Add-to-cart rate
A measure of product page effectiveness and purchase intent. If this is low, the issue is usually things like merchandising and pricing.
Add-to-cart rate = (Add-to-cart events ÷ Product detail page views) × 100
Checkout start rate
Whether cart users are willing to proceed. A drop here typically points to shipping costs or early friction before checkout.
Checkout start rate = (Checkout starts ÷ Carts created) × 100
Checkout completion rate
This one reflects how much demand survives the checkout flow. Drops here can be classic checkout friction, such as limited payment options, long and complex forms, or hidden costs. But payment failures can also be one of them, if “order created” is counted before a successful authorization/settlement. This is exactly why it’s worth pairing this with payment success metrics in the next section.
Checkout completion rate = (Orders created ÷ Checkout starts) × 100
3. The missing layer is payment success
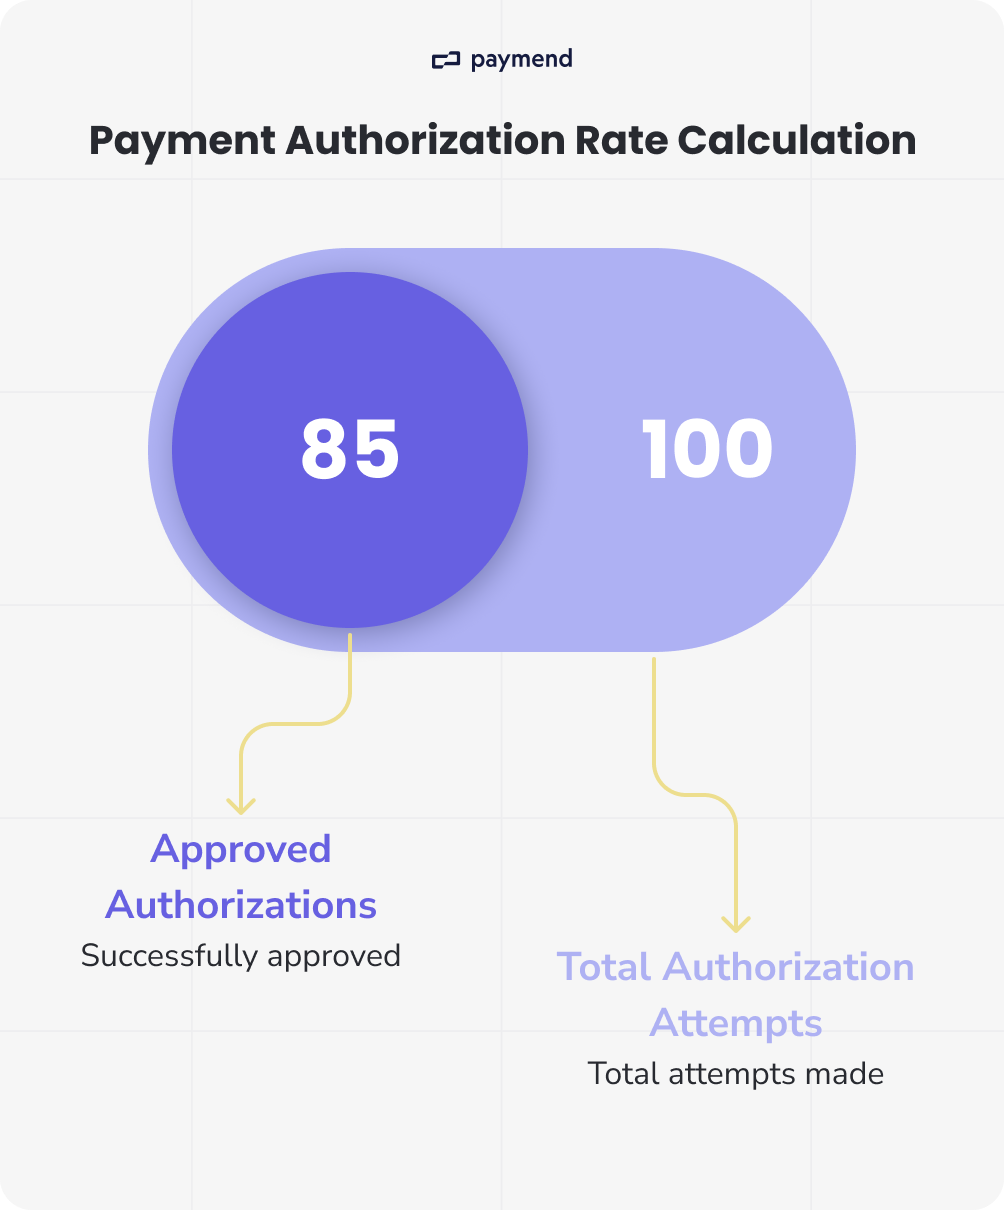
A “completed checkout” flow can still produce a failed purchase if the payment doesn’t authorize. That’s why payments teams track approval outcomes separately. Two practical metrics for this step include:
Payment authorization rate = (Approved authorizations ÷ Total authorization attempts) × 100
Paid order rate = [Paid orders (captured/settled) ÷ Checkout starts] × 100
If your checkout completion looks stable but revenue is soft, you’ve likely found the gap. More attempted purchases might end in declines or other payment failures.
4. How to use these methods together
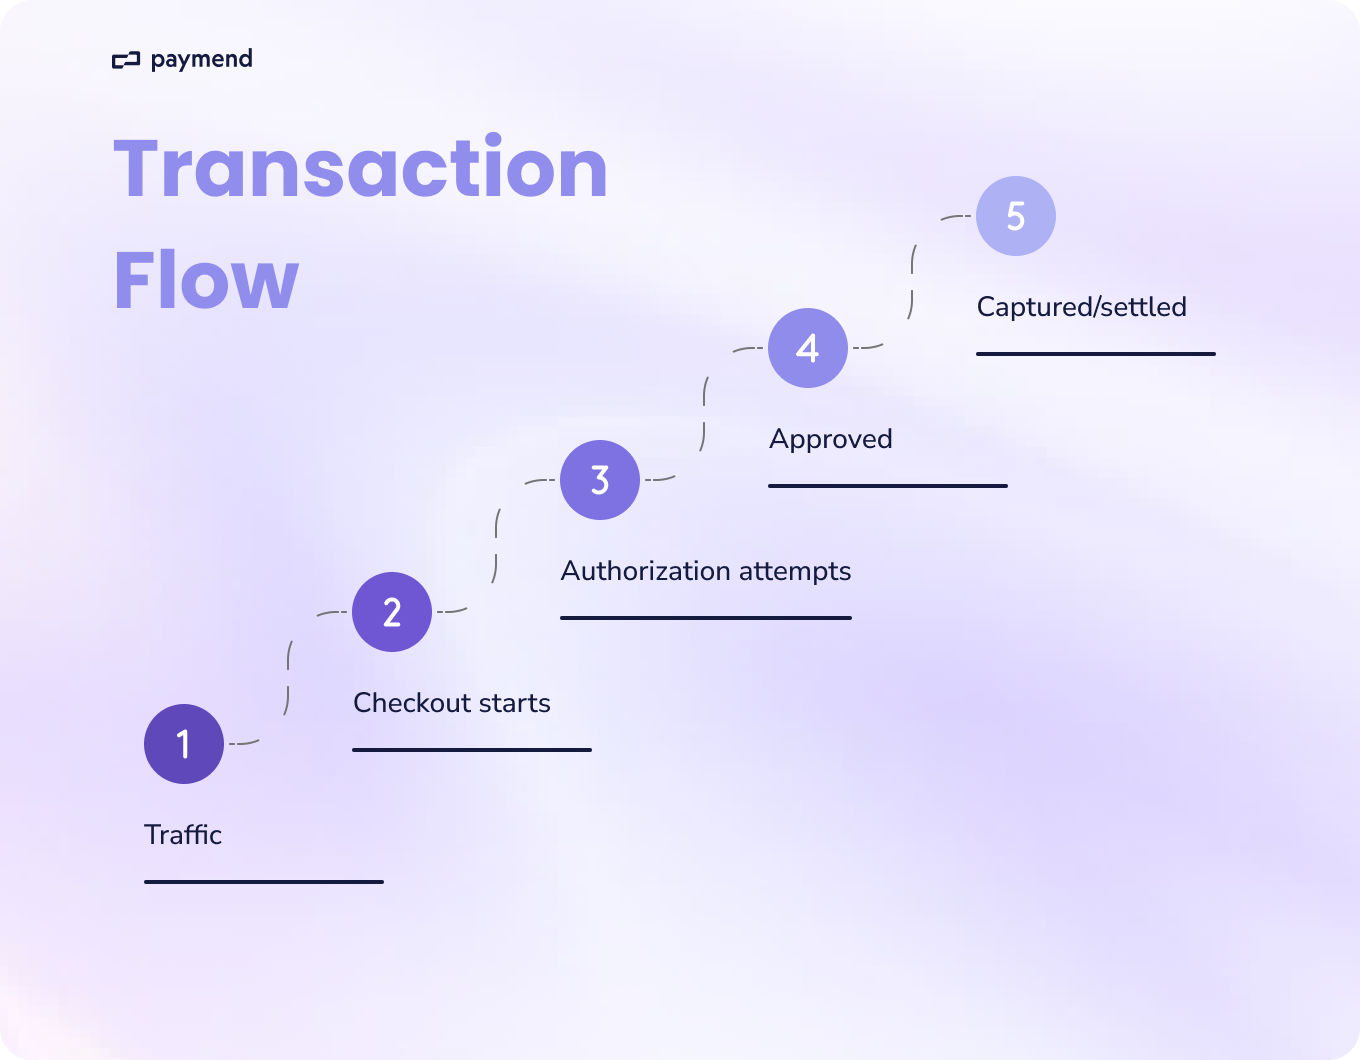
For most finance and payments owners, that last step is where finance can recover revenue. Operationalizing payments for CRO doesn’t require changing the buyer journey when it slots into a simple chain:
Traffic → Checkout starts → Payment authorization attempts → Approvals → Settled orders
With this visibility, you’ll understand whether your conversion problem is truly traffic quality, storefront issues, checkout behavior, payment approvals, or something else.
How does payment success impact e-commerce conversion optimization?
Most conversion rate optimization work focuses on what happens before the payment is attempted, such as UX and checkout flow. Yet in card-not-present merchants, it’s just the point at which a customer attempts to pay. The real conversion moment is when the issuer approves the authorization and when that approval reliably becomes a settled order.
You can reduce checkout steps and use generative AI to refine messaging, and still see revenue underperform if payment approvals slip. That’s because a meaningful share of “checkout drop-off” is not UX at all. It’s intent that reaches the payment rails and gets stopped by issuer decisions or processing conditions.
If you stop your funnel at “orders created,” you’ll overestimate true conversion. A more operational definition of the funnel would be:
Traffic → Checkout starts → Authorization attempts → Approved → Captured/settled
Once you start visualizing this chain, you can separate activities that fail to persuade from payments that don’t go through. In this case, there are two failure baskets that tend to be the problem. Firstly, payment issuers decline due to factors such as risk models, merchant risk thresholds, and fraud controls. Sometimes, good customers (like returning buyers and legitimate spenders) get caught and trigger declines.
Equally, not every failure is an issuer “no.” Some are operational mistakes, including network errors and processor-side failures that prevent an authorization from completing cleanly. Once you can see how payments impact conversion, you can leverage it as a high-impact improvement.
8 e-commerce conversion optimization tips
1. Optimize for revenue per session, not conversion rate
It’s worth noting that conversion rate treats a $20 order the same as a $200 order. It doesn’t tell you whether you increased revenue or profit. In contrast, calculating revenue per session (RPS) ties CRO work to what your finance department ultimately measures.
Sometimes, a conversion lift can come from tactics that reduce order value or margin. For example, discounting products or focusing on lower-priced items. Revenue per session pretty much makes those tradeoffs visible. Although RPS is also sensitive to product performance, as conversion can rise while revenue and profit fall.
Put it to work
Always track these metrics together:
RPS = revenue ÷ sessions
Paid order rate = settled orders ÷ checkout starts
Additionally, you can add segmentation by traffic source and customer type. If RPS only rises in discounted cohorts, you may not have created improvement. The segmentation could be:
- new vs returning
- geo
- device
- traffic source
2. Add settled payments to your funnel reporting
Most funnels stop at “order created.” However, that’s not the same as money in the bank. If payment authorizations fail, you can spend months optimizing product pages and checkout UX while revenue stays flat. Hence, this tip is about measuring conversion based on payment outcomes, not UI milestones.
Put it to work
Make sure you define and log all events, including checkout start, payment authorization attempts, authorization approved/declined, and capture/settlement success.
From here, you can build a simple conversion truth table that answers questions like:
- checkout started → payment attempted?
- payment attempted → approved?
- approved → captured/settled?
3. Identify approval-rate problems by separating new vs returning customers
Returning customers typically have higher purchase intent and an established purchase history. If their approval rate drops, it often indicates a payments or issuer issue rather than a merchandising or messaging issue.
This is a big problem because declines affecting returning customers negatively impact customer lifetime value (LTV) and retention. Let’s say you've already earned the customer's trust and they're ready to repurchase, but losing the payment at authorization squanders that value.
Put it to work
Create a weekly approval report segmented by:
- New vs returning
- Country/region
- Average order value bands
- Device
Then you can look for the approval rate falling for returning customers while the checkout-start rate stays stable. Additionally, you might spot an increase in generic issuer declines for returning customers.
4. Treat generic issuer declines as a specific category with its own plan
“Do not honor” and other generic issuer declines are often grouped into “failed payments” with no follow-up. Therefore, this tip is about making them measurable. Generic declines frequently represent legitimate customers blocked by issuer risk controls. If you treat them as unavoidable, you can recognize avoidable revenue loss.
Put it to work
At the reporting stage, break down declines into actionable buckets:
- Generic issuer declines (e.g., do not honor)
- Suspected fraud/security
- Insufficient funds
- Invalid details
- Processing/network failures
You can track generic declines as the percentage of attempted or the estimated revenue at risk. It’s important to assign an owner to this task, which is usually payments, product, or finance teams who can conduct monthly reviews.
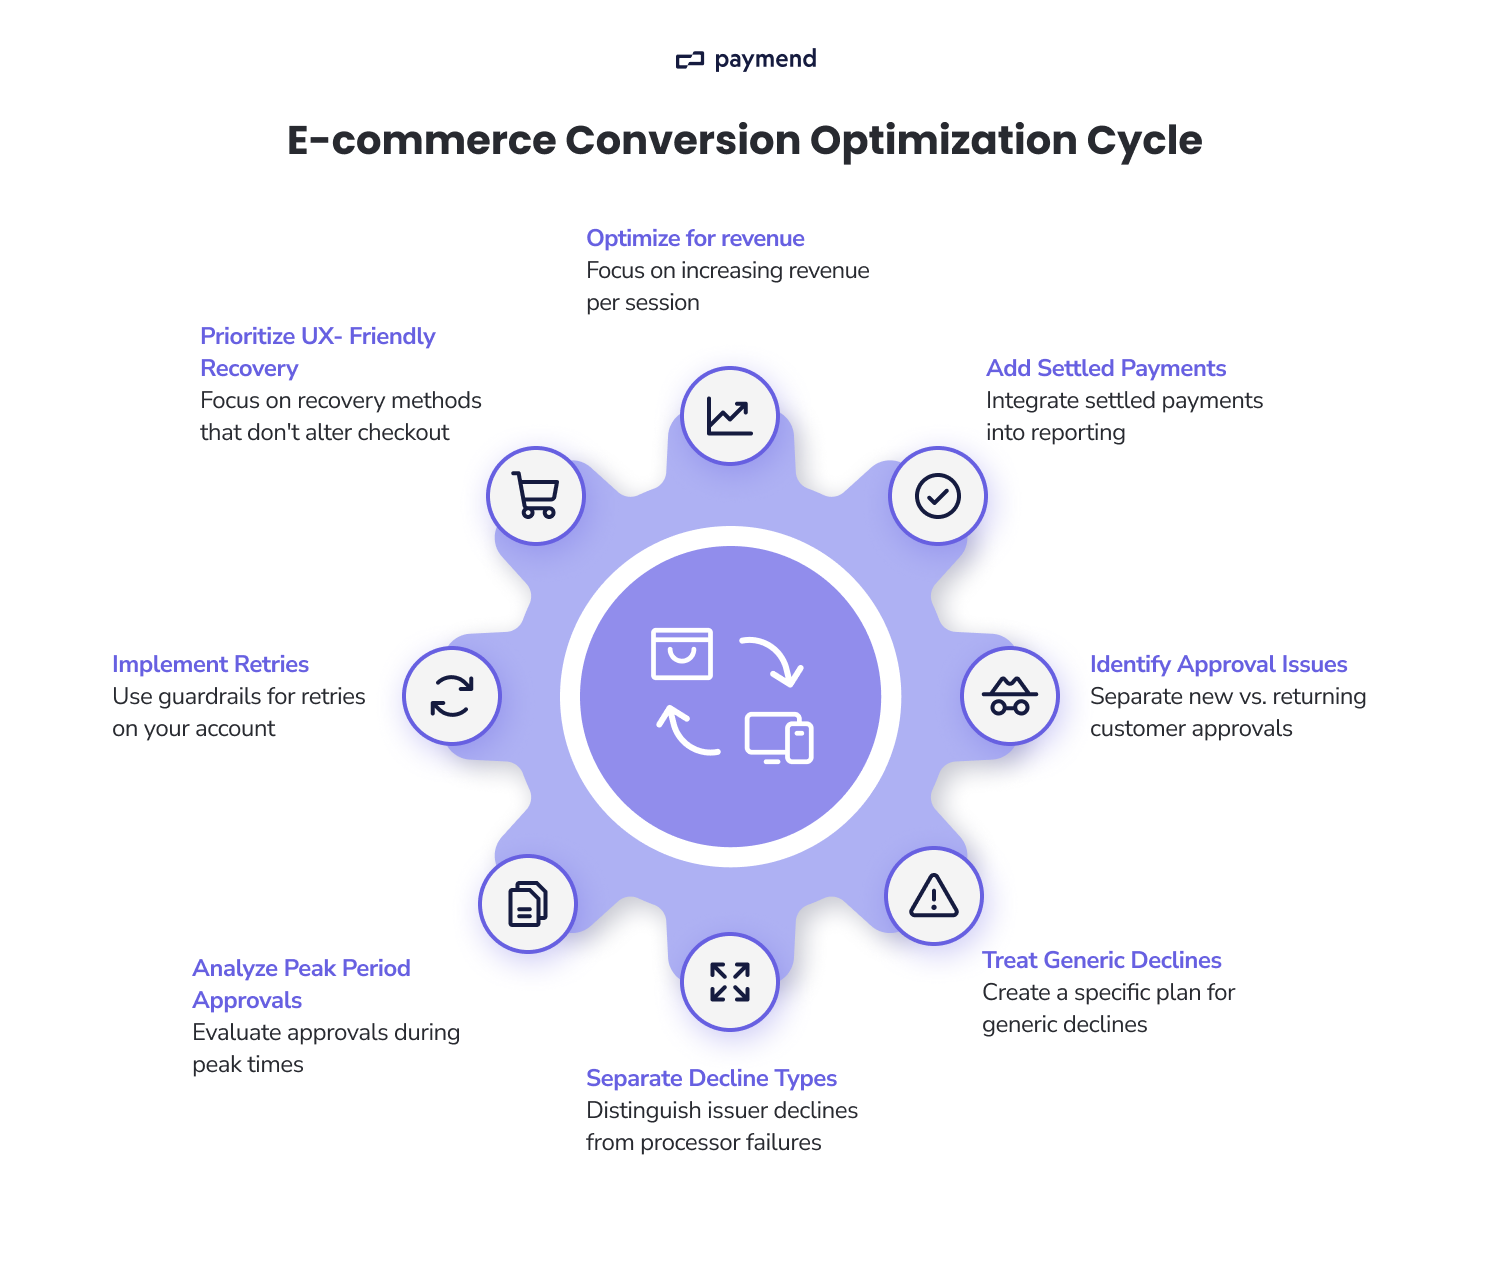
5. Separate issuer declines from processor/network failures in dashboards
Not all failures are issuer decisions. Many are operational clunks, such as gateway and network errors, where the transaction may not have reached the issuer.
Put it to work
Make sure any payment failure logs capture whether the failure was issuer decline, a processor or gateway error, or a network timeout. From here, you can trend each category separately week over week. It’s also a good idea to add alerting for spikes in processing failures, especially around large campaigns and traffic spikes.
6. Analyze approval rates during peak periods, not only weekly averages
Payment approval performance can vary during high-volume windows, such as new product promos or launches. A weekly average can easily hide short, costly drops. After all, most revenue concentration happens in a small number of hours or days. A short approval rate decline during a peak window can have a larger revenue impact than small improvements elsewhere.
Put it to work
Create hourly (or at least daily) views for authorization, settled order, and processing failure rate. You can tag business events, including campaign sends and launch times, which is great for comparing results and project management.
7. Use guardrails to implement retries on your own merchant account
Retrying payment declines can increase approvals, but it can also increase fraud exposure and create patterns that issuers interpret negatively if implemented poorly.
Put it to work
It’s important to set clear retry constraints before you run anything at scale. For example, you could set a maximum number of attempts per transaction or ‘stop conditions,’ such as after a suspected fraud response.
If you want recovery without putting additional exposure on your own merchant setup, consider approaches where declined transactions are handled off your primary merchant accounts. Using a third party means fraud liability is carried by the recovery provider, not pushed back onto you.
8. Prioritize recovery methods that don’t change checkout UX
The best recovery engines treat declined payments as a payments systems problem, not a checkout UX project. The goal is to recover revenue without adding steps for the customer.
After all, you’ll lose a meaningful portion of customers if the payment recovery needs them to take extra actions, such as re-entering checkout or re-authorization prompts.
Put it to work
If you’re evaluating recovery vendors, look for solutions that can run retries without relying on your storefront UX and that keep fraud exposure under control. Some models take full fraud liability for the transactions they process (so recovery doesn’t become a risk transfer back to your team).
Stop treating declines as unavoidable
Conversion optimization isn’t only about getting more shoppers to start checkout. It’s about turning existing intent into paid, settled orders. That’s why the way forward is to measure what happens after: authorization attempts and approvals. Then, you can treat declines as a performance problem, not an unavoidable loss.
If declines are a crucial revenue line item for your business, the fastest path to impact is usually recovery that doesn’t create new checkout friction. Paymend is built to take ownership of declined card transactions, retry them on Paymend’s own merchant accounts, and assume full fraud liability for the transactions.
If you want to see what you’re losing to declines and what’s recoverable, book a call.